I want to display LaTeX equations as the names on one of the axis, using basic plot. I will do this using the TeX() function from {latex2exp}.
Let us generate some dummy data:
library(dplyr)
Attaching package: 'dplyr'
The following objects are masked from 'package:stats':

    filter, lag
The following objects are masked from 'package:base':

    intersect, setdiff, setequal, union
n <-100tb <-tibble(class =rep(c("Model 1 with $X \\sim N(0,1)$","Model 2 with $X \\sim N(1,1)$"),each = n ),y =c(rnorm(n = n, mean =0, sd =1),rnorm(n = n, mean =1, sd =1) )) |>mutate(class =factor(class) )tb
# A tibble: 200 × 2
   class                                 y
   <fct>                             <dbl>
 1 "Model 1 with $X \\sim N(0,1)$" -0.652
 2 "Model 1 with $X \\sim N(0,1)$" -1.02
 3 "Model 1 with $X \\sim N(0,1)$"  0.338
 4 "Model 1 with $X \\sim N(0,1)$"  0.384
 5 "Model 1 with $X \\sim N(0,1)$" -0.424
 6 "Model 1 with $X \\sim N(0,1)$" -0.399
 7 "Model 1 with $X \\sim N(0,1)$"  0.803
 8 "Model 1 with $X \\sim N(0,1)$" -1.21
 9 "Model 1 with $X \\sim N(0,1)$"  0.0629
10 "Model 1 with $X \\sim N(0,1)$" -0.891
# ℹ 190 more rows
The levels:
lvls <-levels(tb$class)lvls
[1] "Model 1 with $X \\sim N(0,1)$" "Model 2 with $X \\sim N(1,1)$"
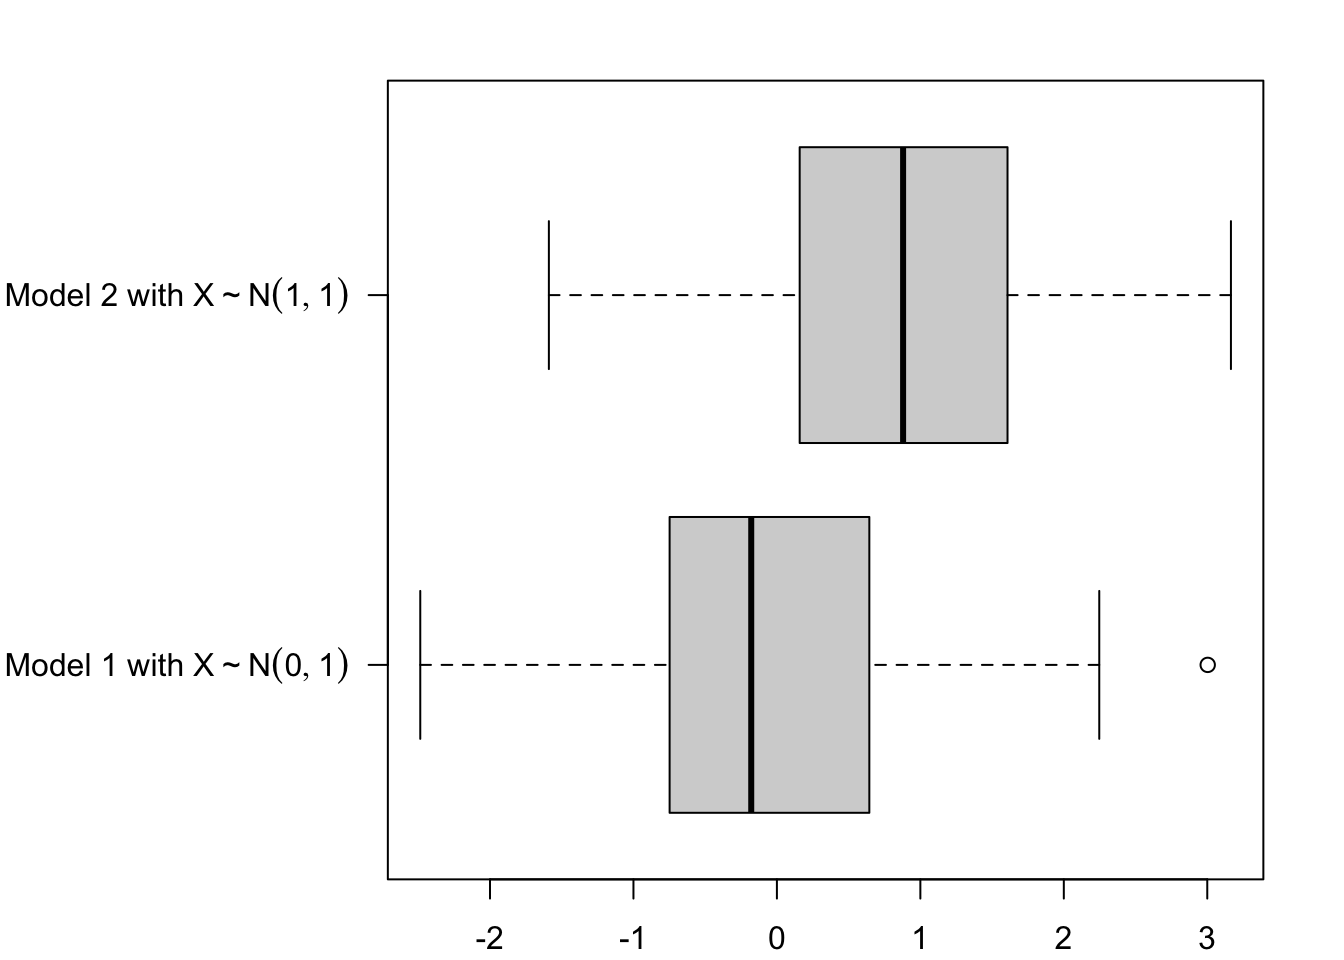
par(mar =c(2.1, 10.1, 2.1, 2.1))boxplot( y ~ class,data = tb,horizontal =TRUE,las =1,xlab =NULL, ylab =NULL,yaxt ="n")# Setting the y axis (with the LaTeX expressions)axis(2, at =1:length(lvls), labels =c(latex2exp::TeX(lvls)),las =2)
Note
Unfortunately, the \mathcal{} is not supported by R.
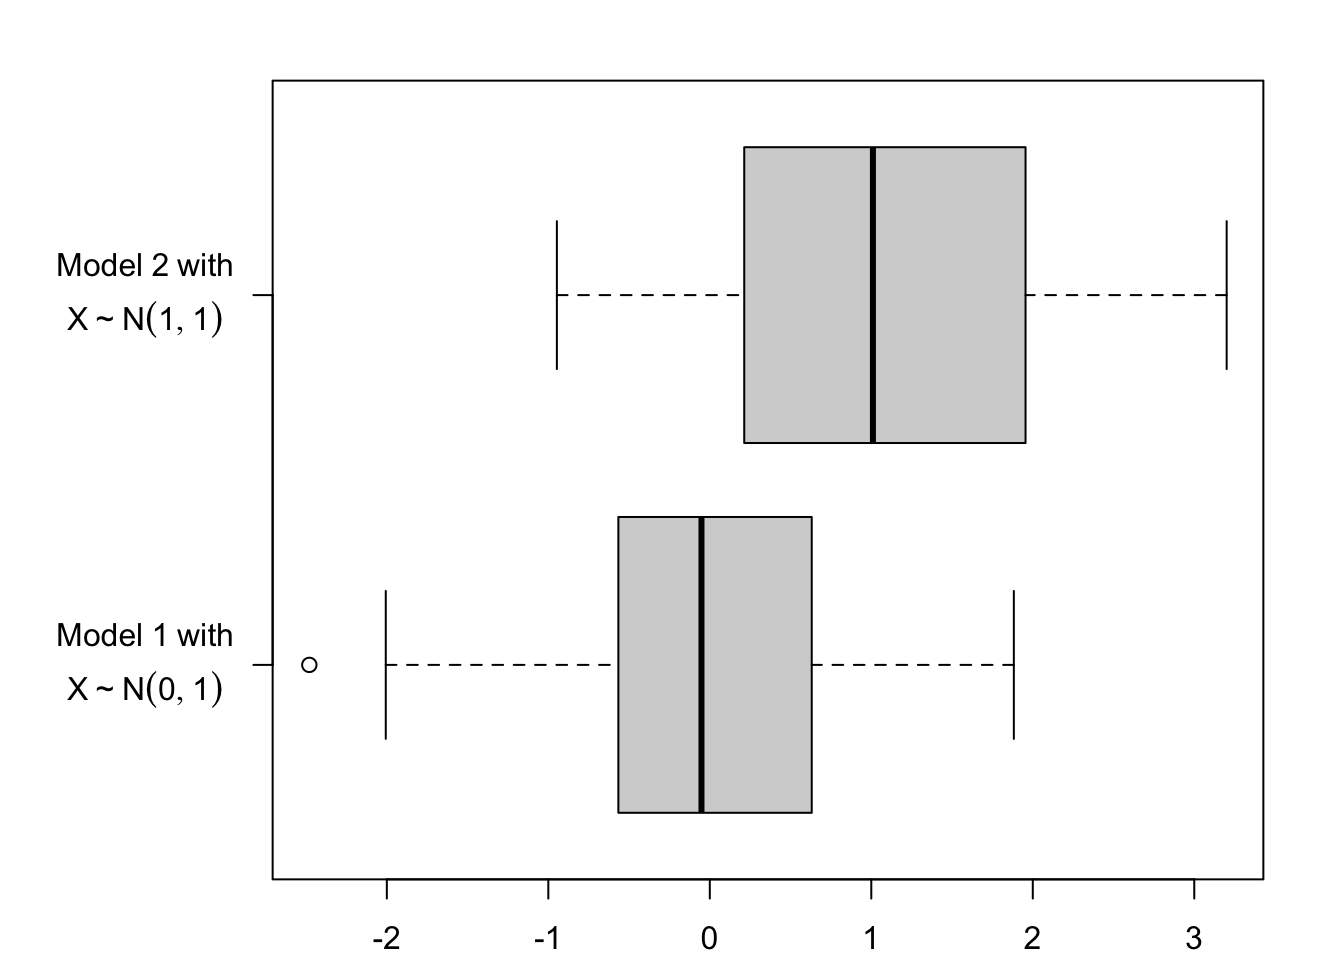
Now, what if we want to add a new line to the labels? It becomes a bit ugly…
tb <-tibble(class =rep(c("$\\overset{\\normalsize{Model~1~with}}{X \\sim N(0,1)}$","$\\overset{\\normalsize{Model~2~with}}{X \\sim N(1,1)}$" ),each = n ),y =c(rnorm(n = n, mean =0, sd =1),rnorm(n = n, mean =1, sd =1) )) |>mutate(class =factor(class) )lvls <-levels(tb$class)par(mar =c(2.1, 7.1, 2.1, 2.1))boxplot( y ~ class,data = tb,horizontal =TRUE,las =1,xlab =NULL, ylab =NULL,yaxt ="n")# Setting the y axis (with the LaTeX expressions)axis(2, at =1:length(lvls), labels =c(latex2exp::TeX(lvls)),las =2)
3.2 Coloured LaTeX Expressions and Tikz
Assume we want to put a part of an equation using a user-defined colour in a plot that will be exported as a tikz picture which will then be executed with PDFLaTeX. To do so, the colour needs to be defined twice:
When exporting the tikz picture, passed on to the packages argument of the tikz() function from {tikzDevice}.
When creating the standalone document that will contain the tikz picture.
library(tikzDevice)
First, define colours in a TeX format. We equip them with useful commands; assume the colour defined is named ColourName, so that the following commands will be created:
\grasColourName: bold and coloured text,
\grasColourNameMath: coloured text in a math environment,
\highlightColourName: coloured box around the coloured text,
\highlightColourNameMath: coloured box around the coloured elements in a math formula (manually add \displaystyle if you are writing sums or integrals, if needed)
The standalone document that will contain the tikz picture can be created with the following function, plot_to_pdf().
#' From plot created with {tikzDevice}, create a standalone latex document#' and compile it with pdflatex to save the plot as pdf#'#' @param filename Name of the tex file (WITHOUT THE EXTENSION) that contains#' the tikzpicture.#' @param path_to_latex Path to LaTeX engine (Defaults to#' `/Library/TeX/texbin/`).#' @param interpreter By default, use pdflatex (`pdflatex`).#' @param path Path to the destination folder.#' @param keep_tex should the tex file (only the one from the standalone doc)#' be kept after compilation? Defaults to `FALSE`.#' @param verbose A logical value indicating whether diagnostic messages are#' printed when measuring dimensions of strings. Defaults to `FALSE`.#' @param ignore.stdout A logical (not NA) indicating whether messages written#' to ‘stdout’ should be ignored. Defaults to `TRUE`.#' @param crop If `TRUE` (default to `FALSE`), the PDF is cropped using pdfcrop.#'plot_to_pdf <-function(filename,path_to_latex ="/Library/TeX/texbin/",interpreter ="pdflatex",path ="./",additional_tex_header ="",keep_tex =FALSE,verbose =FALSE,ignore.stdout =TRUE,crop =FALSE) { content <-paste0("\\documentclass{standalone}\\usepackage{amsmath,amssymb}\\usepackage{graphicx}\\usepackage{array,dcolumn}\\usepackage[T1]{fontenc}\\usepackage[utf8]{inputenc}\\usepackage{nicefrac}\\usepackage{pgfplots}\\usetikzlibrary{pgfplots.groupplots}\\usepackage{xcolor}",paste0(additional_tex_header, collapse ="\n"),"\\begin{document}\\input{", path, filename,".tex}\\end{document}" )# The file which will import the graph in tex format fileConn <-file(paste0(path, filename, "_tmp.tex"))writeLines(content, fileConn)close(fileConn)# Process tex file to get the PDFsystem(paste0( path_to_latex, interpreter, " -shell-escape -synctex=1 -interaction=nonstopmode ", path, filename, "_tmp.tex"),ignore.stdout =TRUE )if (crop ==TRUE) {system(paste0("pdfcrop ", filename, "_tmp.pdf ", filename, "_tmp.pdf" ) ) }if(!path %in%c(".", "./", "/"))system(paste0("mv ", filename, "_tmp.pdf ", path))system(paste0("rm ", filename, "_tmp.aux"))system(paste0("rm ", filename, "_tmp.log"))system(paste0("rm ", filename, "_tmp.synctex.gz"))if (!keep_tex) {system(paste0("rm ", path, filename, "_tmp.tex")) }system(paste0("mv ", path, filename, "_tmp.pdf ", path, filename, ".pdf"))}
Create a graph where two elements will be coloured: a label on the x-axis, and a formula on the graph.
# Parameters of the Gaussian distributionmu <-0sigma <-1# Gridx <-seq(mu -4* sigma, mu +4* sigma, length.out =800)# Densityfx <-dnorm(x, mean = mu, sd = sigma)par(mar =c(4, 4, 3, 1))# Figure dimensionwidth_fig_tkz <-5height_fig_tkz <-3# Name of the file (without the extension), and pathfile_name <-"pdf-gaussian"path_figs <-"figs/"if(!dir.exists(path_figs)) dir.create(path_figs)tikz(paste0(path_figs, file_name, ".tex"),width = width_fig_tkz, height = height_fig_tkz,packages =c(getOption('tikzLatexPackages'), # do not forget to append the current options"\\usepackage{xcolor}","\\usepackage{amsthm,amssymb,amsbsy,amsfonts,amscd,mathrsfs, mathtools}","\\usepackage{amsmath}", colours_tex, macro_colours, macro_color_def ))plot( x, fx,type ="l",lwd =2,main ="Gaussian PDF",xlab ="$x$",ylab ="$f_X(x)$",axes =FALSE)axis(2)axis(1, at =c(-4, -2, 0, 2, 4), labels =c(-4, -2, "${\\color{wongBlue}\\mu}=0$", 2, 4))text(x =-2, y = .3, "$\\highlightwongBlueMath{X\\sim\\mathcal{N}(0,1)}$")dev.off()
quartz_off_screen
                2
# Applying our function to compile the tikz picture and outpout a PDF versionplot_to_pdf(filename = file_name, path = path_figs, additional_tex_header =c(colours_tex, macro_colours, macro_color_def),keep_tex =FALSE, # remove the standalone tex documentcrop =TRUE)# Remove the file containing the tikz picture generated with tikz()system(paste0("rm ", path_figs, file_name, ".tex"))