Brefs rappels

Ewen Gallic
Université de Rennes 1, 2014 - 2015

\[\boldsymbol y = \beta_0 + \beta_1 \boldsymbol x_1 + \beta_2 \boldsymbol x_2 + \cdots + \beta_j \boldsymbol x_j + \cdots + \beta_m \boldsymbol x_m + \boldsymbol \varepsilon,\]
Soit, en termes matriciels : \[\boldsymbol y = \boldsymbol X \boldsymbol \beta + \boldsymbol \varepsilon,\] \[ \textrm{où } \boldsymbol y = \begin{bmatrix} y_1 \\ y_2 \\ \vdots \\ y_n \end{bmatrix}, \, \boldsymbol X = \begin{bmatrix} 1 & x_{11} & x_{12} & \cdots & x_{1m} \\ 1 & x_{21} & x_{22} & \cdots & x_{2m} \\ 1 & \vdots & \vdots & \ddots & \vdots \\ 1 & x_{n1} & x_{n2} & \cdots & x_{nm} \end{bmatrix}, \, \boldsymbol \beta = \begin{bmatrix} \beta_0\\ \beta_1\\ \beta_2\\ \vdots\\ \beta_m \end{bmatrix} \textrm{ et } \boldsymbol \varepsilon = \begin{bmatrix} \varepsilon_1\\ \varepsilon_2\\ \vdots\\ \varepsilon_m \end{bmatrix}. \]
Les coefficients \(\beta_j\) sont inconnus et estimés par \(\hat{\beta}_j\) tels que : \[ \begin{cases} \hat{y_1} & = \hat{\beta}_{0} +\hat{\beta}_1 x_{11} + \hat{\beta}_2 x_{12} + \cdots + \hat{\beta}_j x_{1j} + \hat{\beta}_m x_{1m}\\ \hat{y_2} & = \hat{\beta}_{0} + \hat{\beta}_1 x_{21} + \hat{\beta}_2 x_{22} + \cdots + \hat{\beta}_j x_{2j} + \hat{\beta}_m x_{2m}\\ \vdots & = \vdots\\ \hat{y_n} & = \hat{\beta}_{0} + \hat{\beta}_1 x_{n1} + \hat{\beta}_2 x_{n2} + \cdots + \hat{\beta}_j x_{nj} + \hat{\beta}_m x_{nm}\\ \end{cases}. \]
\[ \textrm{où } \hat{\boldsymbol y} = \begin{bmatrix} \hat{y}_1 \\ \hat{y}_2 \\ \vdots \\ \hat{y}_n \end{bmatrix}, \, \boldsymbol X = \begin{bmatrix} 1 & x_{11} & x_{12} & \cdots & x_{1m} \\ 1 & x_{21} & x_{22} & \cdots & x_{2m} \\ 1 & \vdots & \vdots & \ddots & \vdots \\ 1 & x_{n1} & x_{n2} & \cdots & x_{nm} \end{bmatrix}, \textrm{ et } \hat{\boldsymbol \beta} = \begin{bmatrix} \hat{\beta}_0\\ \hat{\beta}_1\\ \hat{\beta}_2\\ \vdots\\ \hat{\beta}_m \end{bmatrix}. \]
La somme des carrés des résidus est définie par : \[\mid \mid \boldsymbol y - \boldsymbol X \boldsymbol \beta \mid \mid^2 = \sum_{i=1}^{n} (y_i - x_i \beta)^2.\]
La condition du premier ordre donne : \[ \boldsymbol X^t \boldsymbol X\hat{\boldsymbol \beta} - 2 \boldsymbol X^t \boldsymbol X \hat{\boldsymbol \beta} - 2 \boldsymbol X^t \boldsymbol y = 0\notag\\ \Leftrightarrow \quad \boldsymbol X^t \boldsymbol X \hat{\boldsymbol\beta} = \boldsymbol X^t \boldsymbol y\notag\\ \Leftrightarrow \quad \hat{\boldsymbol\beta} = (\boldsymbol X^t \boldsymbol X)^{-1} \boldsymbol X^t \boldsymbol y. \]

grams : masse à la naissance (grammes),gestate : temps de gestation (semaines),educ : nombre d’années d’éducation de la mère (0–17),black : variable indicatrice de la couleur de peau de la mère (1 si oui, 0 sinon),smoke : indique si la mère a fumé pendant la grossesse (1 si oui, 0 sinon).url <- "http://data.princeton.edu/wws509/datasets/phbirths.dat"
births <- read.table(url, header = TRUE)
head(births)
##   black educ smoke gestate grams
## 1 FALSE    0  TRUE      40  2898
## 2  TRUE    0  TRUE      26   994
## 3 FALSE    2 FALSE      38  3977
## 4 FALSE    2  TRUE      37  3040
## 5 FALSE    2 FALSE      38  3523
## 6 FALSE    5  TRUE      40  3100
summary(births)
##    black              educ         smoke            gestate          grams
##  Mode :logical   Min.   : 0.00   Mode :logical   Min.   :20.00   Min.   : 284
##  FALSE:453       1st Qu.:11.00   FALSE:846       1st Qu.:38.00   1st Qu.:2900
##  TRUE :662       Median :12.00   TRUE :269       Median :39.00   Median :3267
##  NA's :0         Mean   :12.27   NA's :0         Mean   :38.84   Mean   :3220
##                  3rd Qu.:13.00                   3rd Qu.:40.00   3rd Qu.:3630
##                  Max.   :17.00                   Max.   :43.00   Max.   :4830
round(cor(births), 2)
##         black  educ smoke gestate grams
## black    1.00 -0.15  0.05   -0.17 -0.26
## educ    -0.15  1.00 -0.23    0.06  0.12
## smoke    0.05 -0.23  1.00   -0.15 -0.23
## gestate -0.17  0.06 -0.15    1.00  0.70
## grams   -0.26  0.12 -0.23    0.70  1.00
library(ggplot2)
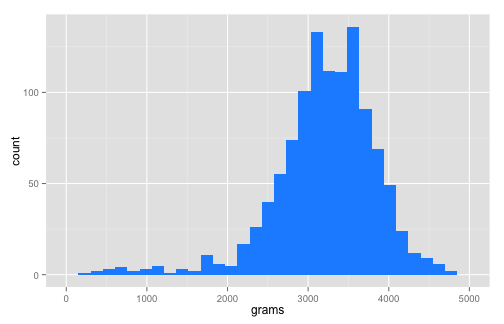
ggplot() + geom_bar(data = births, aes(x = grams), fill = "dodger blue")
## stat_bin: binwidth defaulted to range/30. Use 'binwidth = x' to adjust this.
ggplot() + geom_bar(data = births, aes(x = gestate), fill = "dodger blue")
## stat_bin: binwidth defaulted to range/30. Use 'binwidth = x' to adjust this.

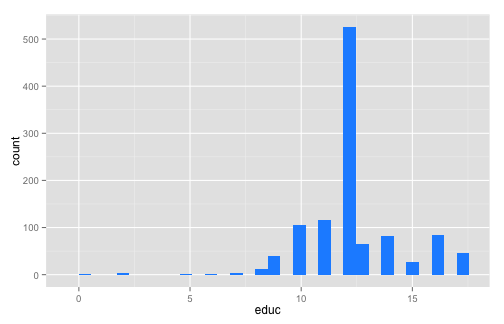
ggplot() + geom_bar(data = births, aes(x = educ), fill = "dodger blue")
## stat_bin: binwidth defaulted to range/30. Use 'binwidth = x' to adjust this.
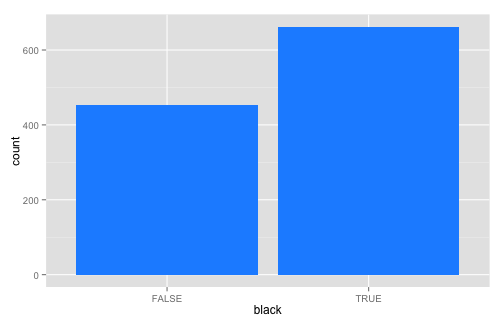
ggplot() + geom_bar(data = births, aes(x = black), fill = "dodger blue")
ggplot() + geom_bar(data = births, aes(x = smoke), fill = "dodger blue")

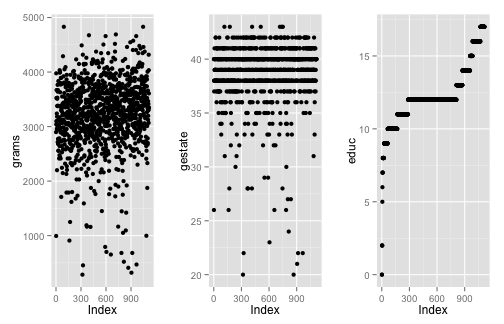
p_1 <- ggplot() + geom_point(data = births, aes(x = seq_along(grams), y = grams)) +
  xlab("Index")
p_2 <- ggplot() + geom_point(data = births, aes(x = seq_along(gestate), y = gestate)) +
  xlab("Index")
p_3 <- ggplot() + geom_point(data = births, aes(x = seq_along(educ), y = educ)) +
  xlab("Index")
library(gridExtra)
grid.arrange(p_1, p_2, p_3, ncol=3)
p_1 <- ggplot(data = births, aes(x = grams, y = gestate)) +
  geom_point() + geom_smooth()
p_2 <- ggplot(data = births, aes(x = educ, y = gestate)) +
  geom_point() + geom_smooth()
p_3 <- ggplot(data = births, aes(x = black, y = gestate)) +
  geom_jitter()
p_4 <- ggplot(data = births, aes(x = smoke, y = gestate)) +
  geom_jitter()
grid.arrange(p_1, p_2, p_3, p_4, ncol=2)
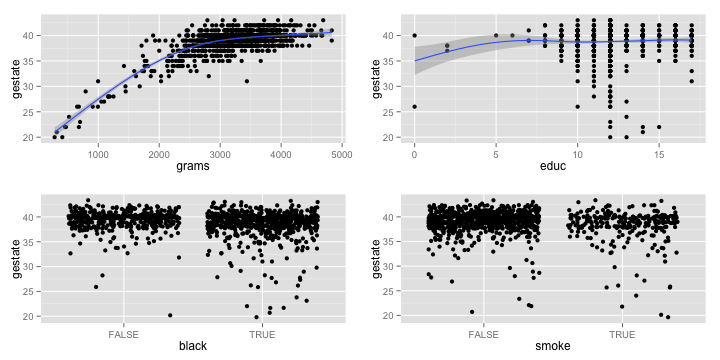

lm()R : lm() ;data.frame au paramètre data.reg <- lm(grams ~ gestate, data = births)
reg
##
## Call:
## lm(formula = grams ~ gestate, data = births)
##
## Coefficients:
## (Intercept)      gestate
##     -3245.4        166.4
lm()I() :reg_2 <- lm(grams ~ gestate + I(gestate^2), data = births)
reg_2
##
## Call:
## lm(formula = grams ~ gestate + I(gestate^2), data = births)
##
## Coefficients:
##  (Intercept)       gestate  I(gestate^2)
##    -4545.933       243.159        -1.108

summary() à cet objet donne de nombreuses informations :
Call : la fomule du moèle,Residuals : des statistiques descriptives des résidus,Coefficients : un tableau à deux entrées où les lignes correspondent aux coeffcients
associés aux variables explicatives, et les colonnes, dans l’ordre, à l’estimation du coefficient, l’écart-type estimé, la valeur du test de Student de nullité statistique du coeffcient et enfin la p-value associé à ce test, suivie d’un symbole pour lire rapidement la signifi- cativité,Signif. codes : les significations des symboles de niveau de significativité,Residual standard error : estimation de l’écart-type de l’aléa et degré de liberté,Multiple R-squared : coeffcient de détermination,Adjusted R-squared :coeffcient de détermination ajusté,F-statistic : valeur de la statistique de Fisher du test de significativité globale, ainsi que les degrés de liberté et la p-value associée au test.summary(reg)
##
## Call:
## lm(formula = grams ~ gestate, data = births)
##
## Residuals:
##      Min       1Q   Median       3Q      Max
## -1512.41  -302.17   -12.41   285.15  1584.04
##
## Coefficients:
##             Estimate Std. Error t value Pr(>|t|)
## (Intercept) -3245.45     197.01  -16.47   <2e-16 ***
## gestate       166.45       5.06   32.89   <2e-16 ***
## ---
## Signif. codes:  0 '***' 0.001 '**' 0.01 '*' 0.05 '.' 0.1 ' ' 1
##
## Residual standard error: 451.3 on 1113 degrees of freedom
## Multiple R-squared:  0.4929, Adjusted R-squared:  0.4925
## F-statistic:  1082 on 1 and 1113 DF,  p-value: < 2.2e-16
X <- matrix(c(rep(1, nrow(births)), births$gestate), ncol = 2)
y <- births$grams
(hatBeta <- solve(crossprod(X)) %*% crossprod(X,y))
yChap <- X %*% hatBeta
residus <- y - yChap
SCE <- sum((yChap - mean(y))^2)
SCT <- sum((y - mean(y))^2)
R2 <- SCE / SCT
m <- 4
n <- nrow(births)
R2a <- 1 - ((n-1) / (n-m-1)) * (1-R2)
SCR <- sum(residus^2)
hatSigma2_u <- SCR / (n-m-1)
varcov <- hatSigma2_u * solve(t(X) %*% X)
hatSigmaBetas <- sqrt(diag(varcov))
tObs <- hatBeta / hatSigmaBetas
T_tab <- qt(p = 1-0.05/2, df = n-m-1)
ifelse(abs(tObs) > T_tab, "Rejet H_0", "Non rejet H_0")
2*pt(q = abs(tObs), df = n-m-1, lower.tail=FALSE)
F_obs <- (R2 / m) / ((1-R2) / (n-m-1))
F_tab <- qf(p = 1-0.05, df1 = m, df2 = n-m-1)
1 - pf(q = F_obs, df1 = m, df2 = n-m-1)

coefficients : un vecteur de coeffcients (nommé),resiuals : les résidus,fitted.values : les valeurs estimées,df.residual : nombre de degrés de liberté.names() :names(reg)
##  [1] "coefficients"  "residuals"     "effects"       "rank"
##  [5] "fitted.values" "assign"        "qr"            "df.residual"
##  [9] "xlevels"       "call"          "terms"         "model"
reg$coefficients
## (Intercept)     gestate
##  -3245.4464    166.4463
ggplot() + geom_point(data = data.frame(residuals = reg$residuals),
                      aes(x = seq_along(residuals), y = residuals), alpha = .5) +
  xlab("") + ylab("Résidus")
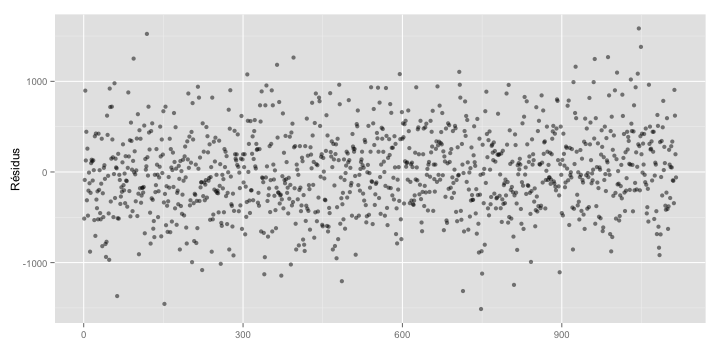
library(plyr)
ggplot() + geom_point(data = arrange(data.frame(residuals = reg$residuals,
                                                grams = births$grams), grams),
                      aes(x = seq_along(residuals), y = residuals), alpha = .5) +
  xlab("") + ylab("Résidus")
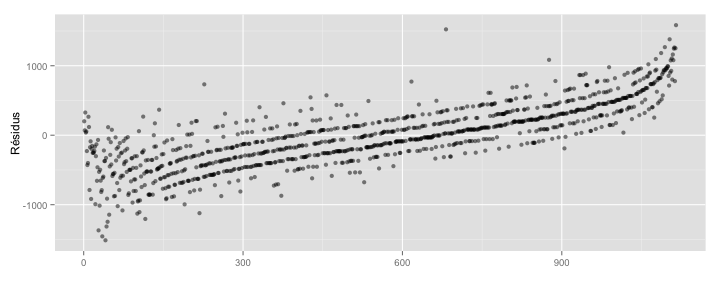
residuals(reg),resid(reg),reg$residuals ;fitted(reg) ;coefficients(reg),coef(reg),reg$coefficientsqqplot <- function(y, distribution=qnorm, title = "Droite de Henry",
xlab = "Quantiles théoriques",
ylab = "Résidus studentisés") {
if(class(y) == "lm"){
# Résidus
r <- residuals(y)
# Résidus studentisés
y <- r / sqrt(deviance(y) / df.residual(y))
}
x <- distribution(ppoints(y))
df <- data.frame(x = x, y = sort(y))
ggplot(df, aes(x = x, y = y)) +
geom_point() +
geom_abline(intercept = 0, slope = 1, col = "red") +
ggtitle(title) +
xlab(xlab) + ylab(ylab)
}
qqplot(reg)
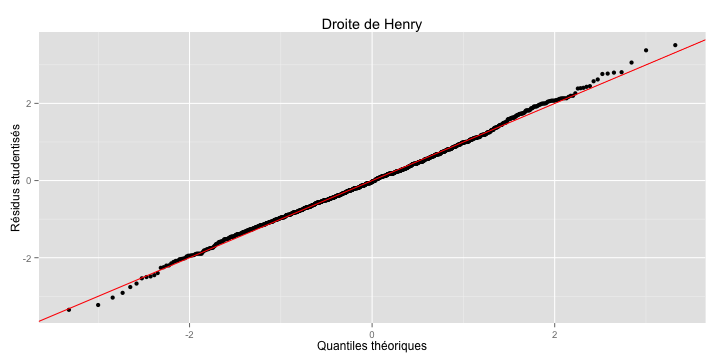
data.frame diamonds, régresser le prix (price) sur la masse (carat) et de la profondeur (depth) ;factor ;R :
data.frame,factor() dans la formule, lors de l'appel de la régression ;character ou logical, R la transforme en factor durant le temps de l'estimation ;R ;relevel(), ou directement avec factor().class(births$smoke)
## [1] "logical"
summary(reg_3 <- lm(grams ~ gestate + smoke + black, data = births))
##
## Call:
## lm(formula = grams ~ gestate + smoke + black, data = births)
##
## Residuals:
##      Min       1Q   Median       3Q      Max
## -1464.13  -295.56     1.86   287.70  1611.83
##
## Coefficients:
##              Estimate Std. Error t value Pr(>|t|)
## (Intercept) -2713.653    199.723 -13.587  < 2e-16 ***
## gestate       156.570      5.016  31.213  < 2e-16 ***
## smokeTRUE    -185.015     30.883  -5.991 2.82e-09 ***
## blackTRUE    -174.402     27.027  -6.453 1.64e-10 ***
## ---
## Signif. codes:  0 '***' 0.001 '**' 0.01 '*' 0.05 '.' 0.1 ' ' 1
##
## Residual standard error: 436.3 on 1111 degrees of freedom
## Multiple R-squared:  0.5269, Adjusted R-squared:  0.5256
## F-statistic: 412.4 on 3 and 1111 DF,  p-value: < 2.2e-16
R faire en fonction de l'ordre alphanumérique :births$smoke <- factor(births$smoke)
levels(births$smoke)
## [1] "FALSE" "TRUE"
TRUE comme référence :births$smoke <- relevel(births$smoke, ref = "TRUE")
factor() pour définir la référence et d'éventuelles étiquettes :births$black <- factor(births$black, levels = c("TRUE", "FALSE"),
labels = c("Black", "Not Black"))
summary(reg_3 <- lm(grams ~ gestate + smoke + black, data = births))
##
## Call:
## lm(formula = grams ~ gestate + smoke + black, data = births)
##
## Residuals:
##      Min       1Q   Median       3Q      Max
## -1464.13  -295.56     1.86   287.70  1611.83
##
## Coefficients:
##                 Estimate Std. Error t value Pr(>|t|)
## (Intercept)    -3073.071    191.836 -16.019  < 2e-16 ***
## gestate          156.570      5.016  31.213  < 2e-16 ***
## smokeFALSE       185.015     30.883   5.991 2.82e-09 ***
## blackNot Black   174.402     27.027   6.453 1.64e-10 ***
## ---
## Signif. codes:  0 '***' 0.001 '**' 0.01 '*' 0.05 '.' 0.1 ' ' 1
##
## Residual standard error: 436.3 on 1111 degrees of freedom
## Multiple R-squared:  0.5269, Adjusted R-squared:  0.5256
## F-statistic: 412.4 on 3 and 1111 DF,  p-value: < 2.2e-16
data.frame mtcars, effectuer la régression de la consommation (mpg) en fonction de la masse (wt) et du nombre de cylindres (cyl, à prendre en variable catégorielle) ;cyl.\[ \begin{cases} H_0 : \beta_i = 0\\ H_1 : \beta_i \ne 0 \end{cases}, i = 1, 2, \ldots, m. \]
summary() sur l'objet retourné par la fonction lm() ;confint() :confint(reg_3)
##                     2.5 %     97.5 %
## (Intercept)    -3449.4726 -2696.6686
## gestate          146.7278   166.4120
## smokeFALSE       124.4204   245.6101
## blackNot Black   121.3724   227.4324
confint(reg_3, level = 0.95)
##                     2.5 %     97.5 %
## (Intercept)    -3449.4726 -2696.6686
## gestate          146.7278   166.4120
## smokeFALSE       124.4204   245.6101
## blackNot Black   121.3724   227.4324
On peut estimer la variance inconnue \(\sigma^2_\varepsilon\) par son estimation \(\hat{\sigma}^2_\varepsilon\).
Dès lors, on a : \[ \frac{z_i^p - \mathbb{E}(z_i^p)}{\hat{\sigma}_{\varepsilon}} \sim \mathcal{S}t(n-2). \]
Il est alors possible de construire un intervalle de confiance au seuil de \(\alpha\) pour \(y_i^p\), soit : \[ \widehat{\textrm{I.C.}_{y_{n+1}}(1-\alpha)} = \left[ \hat{y}_{n+1}^p \pm t_{1-\alpha/2} \cdot \hat{\sigma}_{z_{n+1}^p} \right], \]
où \(t_{1-\alpha/2}\) est la valeur du fractile lue dans la table pour \(\alpha\) et \(\gamma = n-2\) degrés de liberté.
predict()R propose la fonction predict() pour calculer cet intervalle de prévision ;lm() en paramètre ;data.frame contenant les nouvelles valeurs (sinon, predict() retourne les valeurs estimées) ;data.frame que ceux passés dans la formule.predict()donnees_supl <- data.frame(black = factor(c(TRUE, FALSE),
levels = c(TRUE, FALSE),
labels = c("Black", "Not Black")),
educ = c(10,5),
smoke = factor(c(FALSE, FALSE)),
gestate = c(39, 43))
predict(reg_3, newdata = donnees_supl)
##        1        2
## 3218.171 4018.853
predict()"prediction" au paramètre interval ;level permet de spécifier un niveau différent.predict(reg_3, newdata = donnees_supl, interval = "prediction")
##        fit      lwr      upr
## 1 3218.171 2361.229 4075.113
## 2 4018.853 3161.006 4876.700
predict()predict(reg_3, newdata = donnees_supl, interval = "prediction", level = 0.9)
##        fit      lwr      upr
## 1 3218.171 2499.187 3937.155
## 2 4018.853 3299.109 4738.597
predict()TRUE au paramètre se.fit :predict(reg_3, newdata = donnees_supl, interval = "prediction", se.fit = TRUE)
## $fit
##        fit      lwr      upr
## 1 3218.171 2361.229 4075.113
## 2 4018.853 3161.006 4876.700
##
## $se.fit
##        1        2
## 18.79725 27.50835
##
## $df
## [1] 1111
##
## $residual.scale
## [1] 436.3423
Reprendre la régression de la consommation (mgp) sur la masse (wt) et le nombre de cylinres (cyl), les données étant dans le data.frame mtcars, en excluant la première observations :
reg <- lm(mpg ~ wt + factor(cyl), data = mtcars[-1,])
data.frame mtcars.texreg propose des fonctions pour exporter les résultat de régression :
HTML : htmlreg(),LaTeX : texreg ;HTML, il est aisé de copier/coller un tableau dans Word...l : un modèle statistique, ou une liste de modèles,file : le résultat est exporté dans un fichier dont le chemin et le nom sont donnés à ce
paramètre,single.row : par défaut, deux lignes sont réservées par coeffcient de la régression, avec
le coeffcient sur la première ligne, et l’écart-type sur la seconde. Si la valeur vaut TRUE,
le coeffcient et son écart-type sont placés dans une celle cellule, sur la même ligne,custom.model.names : un vecteur de caractères avec les étiquettes pour chaque modèle
(au lieu de "Model 1", "Model 2", etc.),custom.coef.names : un vecteur de caractères avec les étiquettes pour chaque variable
du modèle,digits : nombre de décimales,caption : titre pour le tableau.library(texreg)
htmlreg(reg_3, digits = 2, caption = "Résultats de la régression")
texreg(reg_3, digits = 2, caption = "Résultats de la régression")
htmlreg(reg_3, file = "reg_3.html") texreg(reg_3, file = "reg_3.tex")
screenreg propose d'afficher dans la console un aperçu de ce à quoi ressemblera la sortie :screenreg(list(reg, reg_3), digits = 2,
custom.model.names = c("Rég. Lin. Simple", "Reg. Lin. Mult."))